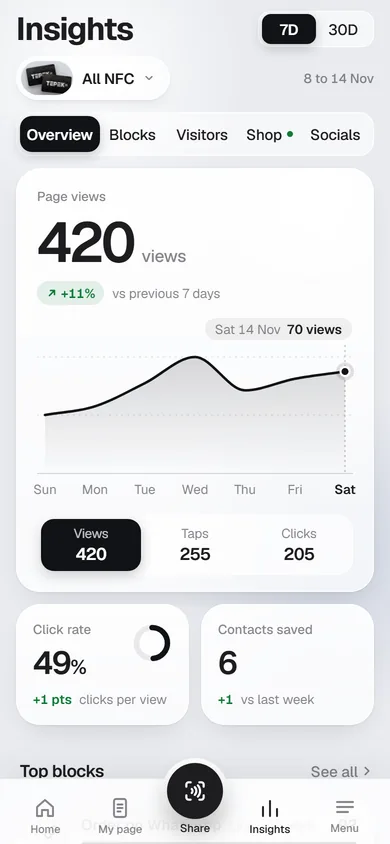
Insights shows what happens after you share your page: how many people opened it, how they got there, and what they tapped. You do not need to check it every day. Once a week, or the day after you post or print something new, is enough to learn what works.
Pick the period and the NFC
At the top are 7D and 30D: the last 7 or 30 days, in Malaysian time. Free shows the last 7 days; 30 days comes with Lifetime. Every number is compared with the period before it, so “+12” next to views means 12 more than the previous 7 days.
If you have more than one NFC, pick one to see only its numbers, or all of them together. Each NFC has its own page, so your counter card and your keychain are counted apart.
Overview: the four numbers
- Views: how many times your page was opened. A visitor who reloads or comes back to the same tab counts once.
- Taps: how many times someone tapped one of your NFC cards to open the page.
- Clicks: taps on your links, buttons and blocks once the page was open.
- Click rate: clicks per view, as a percentage. Its change is shown in points: from 20% to 25% is +5 pts.
The chart at the top shows one of views, taps or clicks day by day; tap the one you want. Next to it, Contacts saved counts how many times someone pressed your Save contact button.
Crawlers, uptime checkers and the link previews WhatsApp and Facebook make when a link is pasted are never counted, so a burst of shares does not inflate your views.
Top blocks and the Blocks tab
Top blocks on Overview lists your most tapped blocks. The Blocks tab shows every block, most clicked first, as clicks or as a share of all clicks. This is where you learn which buttons earn their place. A button near the top that nobody taps is taking the spot of one that would be.
Visitors: who came and from where
The Visitors tab starts with the number of visitors, split into New and Returning, then Avg time on page. A returning visitor is someone whose phone opened your page before; someone not seen for over a year counts as new again.
Sources splits your page views by how people arrived:
- NFC tap: one of your Tepek cards.
- QR scan: the QR code from your Share sheet.
- Shared link: a link sent with Copy link or the WhatsApp button in the Share sheet.
- Instagram bio: a visit from inside Instagram.
- WhatsApp: your link opened from a WhatsApp chat.
- Direct: everything else, such as TikTok, a typed address or a link from another site.
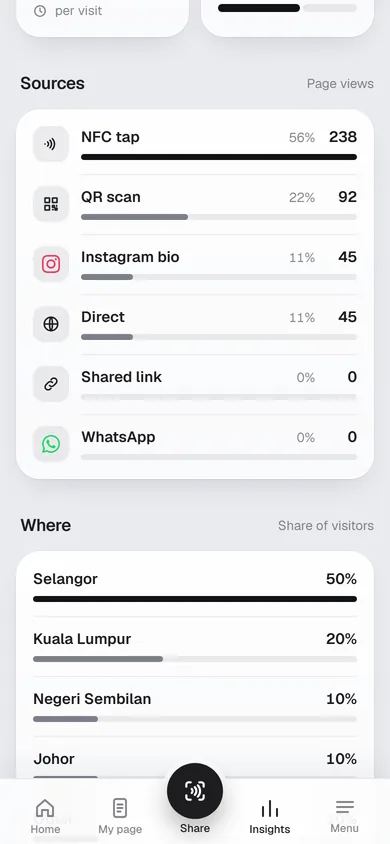
Below Sources, Where shows the Malaysian states your visitors were in (the top four, the rest as Other, and every visit from outside Malaysia as Other). It comes from the network’s location, and Tepek never keeps the visitor’s IP address. Devices splits Android, iPhone and other, and Busiest time shows page views by day of the week.
Socials
The Socials tab can connect your social accounts, so followers, engagement and posts sit next to the clicks your page sends to each one. Tepek only reads public numbers. Without a connected account it shows the clicks your page sent to each network.
Three questions to ask each week
- Did more people find me? Look at views and their change. If they dropped, ask what you stopped doing: a post, a code on the counter, a card in a customer’s hand.
- Where did they come from? Look at Sources. If QR scan is zero after you put up a code, move the code or give people a reason to scan it.
- Did they do anything? Look at click rate and Top blocks. A low click rate on a busy page can mean the first button is not what visitors came for.
Try one change at a time
Change one thing, wait a week, and compare: a new title on your order button, a different first block, a code in a new spot. With one change at a time, the numbers tell you which one worked. Add a WhatsApp order button and Share your page with a QR code are good first experiments.